

Content
- CIO Note
- Cryptocurrency market performance
- Quarterly Asset Performance
- Bitcoin
- Bitcoin On-Chain
- Ethereum
- Ethereum On-Chain
- Derivatives
- Options
- Futures
- Decentralized Finance
- Total Value Locked
- DeFi Exploits
- Terra’s Fall From Grace
- Funds Mismanagement At The Highest Level
- Celsius
- Three Arrows Capital
- NFTs & Metaverse
- Overview
- Solana Inflows & Free Mints
- Emerging Themes
- Crypto In the Regulator’s Crosshairs
- Binance ICO Investigation
- Nathaniel Chastain Case
- Lummis Bill
- EU Releases MiCA Regulations
- Layer 2 Growth
- Macro Overview
- Economic and Market Update
- Zerocap Products
- Performance of Zerocap Products
- ZC Funds - Bitcoin Trust and Smart Beta
- Yield Entry and Exit Notes
- Principal Protected Notes
- Contact
- FAQs
- What is Zerocap's role in the digital assets market?
- What were the key highlights in the crypto market in Q2 2022?
- How did regulatory attention impact the crypto industry in Q2 2022?
- What was the performance of the cryptocurrency market in Q2 2022?
- What were the significant events in the DeFi space in Q2 2022?
14 Jul, 22
Zerocap Q2 2022 Report
- CIO Note
- Cryptocurrency market performance
- Quarterly Asset Performance
- Bitcoin
- Bitcoin On-Chain
- Ethereum
- Ethereum On-Chain
- Derivatives
- Options
- Futures
- Decentralized Finance
- Total Value Locked
- DeFi Exploits
- Terra’s Fall From Grace
- Funds Mismanagement At The Highest Level
- Celsius
- Three Arrows Capital
- NFTs & Metaverse
- Overview
- Solana Inflows & Free Mints
- Emerging Themes
- Crypto In the Regulator’s Crosshairs
- Binance ICO Investigation
- Nathaniel Chastain Case
- Lummis Bill
- EU Releases MiCA Regulations
- Layer 2 Growth
- Macro Overview
- Economic and Market Update
- Zerocap Products
- Performance of Zerocap Products
- ZC Funds - Bitcoin Trust and Smart Beta
- Yield Entry and Exit Notes
- Principal Protected Notes
- Contact
- FAQs
- What is Zerocap's role in the digital assets market?
- What were the key highlights in the crypto market in Q2 2022?
- How did regulatory attention impact the crypto industry in Q2 2022?
- What was the performance of the cryptocurrency market in Q2 2022?
- What were the significant events in the DeFi space in Q2 2022?
CIO Note
This Q2, the flow on effects of a continued liquidity crunch as well as the weight of a hawkish macro environment burdened the market. In Q2, Bitcoin and Ethereum witnessed historically significant drawdowns, with the latter facing eleven straight weeks of negative returns. This being said, consistent accumulation and buy-side flows on the desk were key highlights this Q2. Notably, we saw continued interest in Zerocap’s Structured Product offering. As a result, clients were able to earn healthy yields whilst awaiting market entries. This was especially beneficial in the current environment given the heightened risk in the credit lending market.
Risk management captured the spotlight as Q2’s overarching theme. Parties that were over-exposed to exploited DeFi or CeFi platforms; Terra’s (LUNA) tokens, or compromised credit counterparties stemming from the collapse of Three Arrows Capital, experienced a very rocky few months. Whilst the mismanagement of duration risk and leverage weighed heavily on the industry and forced billions of dollars in selling pressure, the resulting flush out provided the space with clarity surrounding the value of placing assets / interacting with:
- Regulated firms with diligent risk management practices
- Trustless and permissionless protocols with sustainable offerings
- Custody solutions with self-sovereign private key ownership
A notable uptick in regulatory attention persisted throughout Q2. In the US, the SEC launched an investigation into the Binance ICO from 2017. Similarly, the Lummis Bill was introduced and intends to provide further structure to the industry’s regulatory framework in the US. In Europe, detailed updates were made to the markets in crypto assets (MiCA) framework with the intent to guard against market abuse and manipulation.
Based on the events that took place during the last three months, it is likely that global regulatory attention will continue. However, it appears that regulatory focus, at least for the time being, will be placed on investor protections and safe practices. Such developments will ultimately benefit both the crypto industry and its participants. It is also likely to remove the barrier to entry for a number of investors sitting on the sideline pending further regulatory clarity.
The first half of this year has marked the worst bi-annual return for the S&P since 1970. Looking to next quarter and beyond, it can be expected that rate hikes and quantitative tightening will persist, ultimately limiting risk asset allocation. That being said, the consistency of accumulation in assets, like BTC, shows promise for a consolidation phase in the near-term. For long-term investors this provides a great opportunity to reposition and average in.
While current market conditions appear bleak, it is important to recognise that this is not unfamiliar territory for the asset class. Just as macro conditions will gradually become more favourable, so too will the crypto market recover. The tough call is, and always has been, timing. Taking a long-term view and utilising tools such as Structured Products is the aim of the game.
All the best for Q3.
Cryptocurrency market performance
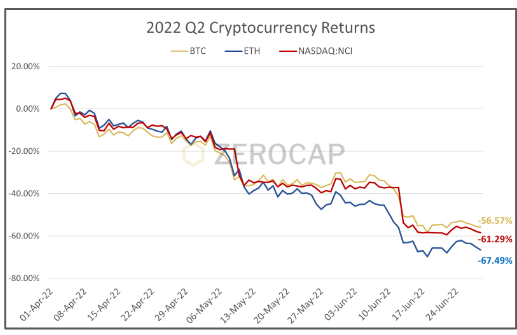
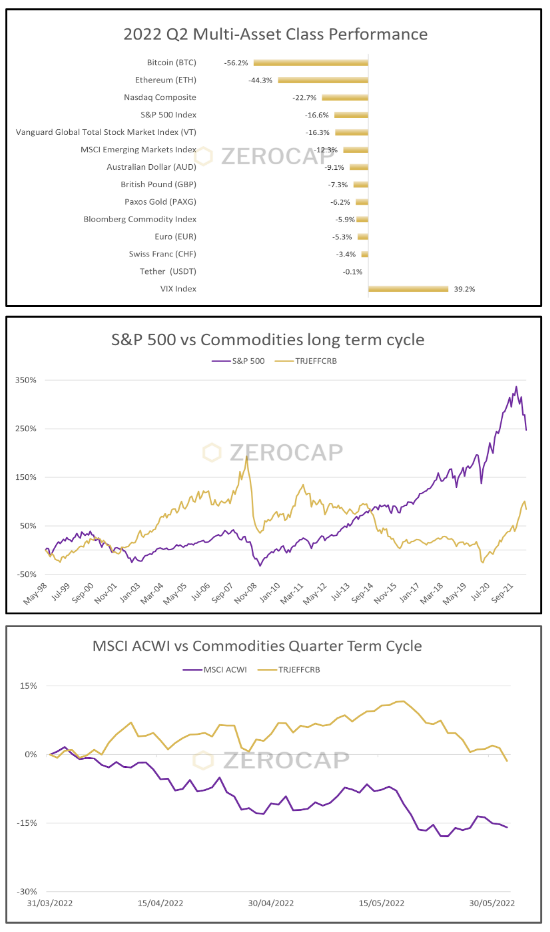
Following the release of April’s 9.20% year-on-year inflation figures for OECD nations, the hawkish macro theme remained front of mind. A series of record rate hikes from various monetary authorities led to contractions across asset classes. In June, the US Federal Reserve hiked interest rates by 0.75%, the largest benchmark rate increase since 1994. The SPX and the Nasdaq Crypto Index (NCI) retraced -16.63% and -61.29% respectively in Q2 2022.
The collapse of Terra Labs’ LUNA and Terra USD in May caused significant marketwide selling pressure on an already despondent market. LUNA’s $40 billion market cap fell to a mere $1.4 billion in one month. The resulting wave of contagion spread throughout the crypto markets with participants feeling its bite. Exaggerated by significant liquidations, BTC plummeted through key support levels at $30,000 and $20,000.
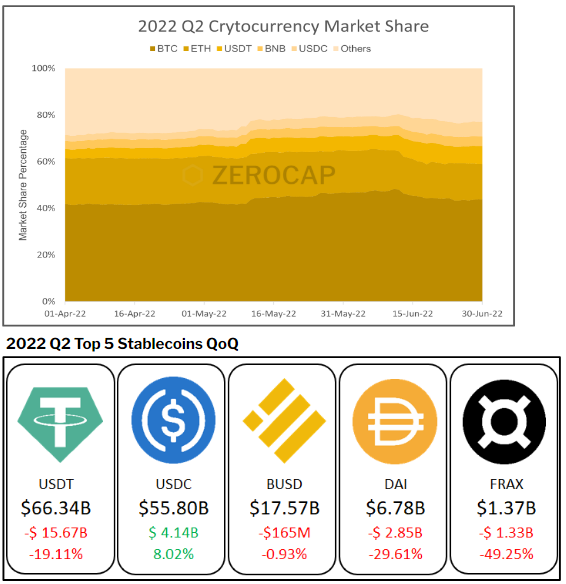
In Q2, the total cryptocurrency market capitalization contracted 58.82%. Alongside the diminished market size was a notable risk-off mandate. This behaviour was reflected by significant flows into stablecoins. As investors fled from altcoins, USDT’s and USDC’s market share more than doubled. However, suspicions regarding USDT’s reliance on commercial paper and a potential exposure to Evergrande’s bad debt arose. USDT’s lack of reserve transparency was matched with growing frustration amongst investors. USDT/USD redemptions climbed to over $8 billion this Q2 as short interest on the stablecoin caused it to de-peg to ~0.95 temporarily. In real terms, USDT’s market capitalisation actually decreased by 19.11% whereas USDC’s grew by 8.02%. The divergence in USDT and USDC’s respective market share growth suggests a potential ‘flippening’ event may be on the horizon, supported by the incoming regulatory wave and investor demand for more transparency.
This Q2, Bitcoin’s total cryptocurrency market share increased 1.77% while Ethereum experienced a 4.76% decrease. Ethereum’s decreasing market share is likely a result of a contraction in allocation from firms that were previously overzealous in building exposure to the PoS merge narrative and general risk off macro themes.
Quarterly Asset Performance
Bitcoin
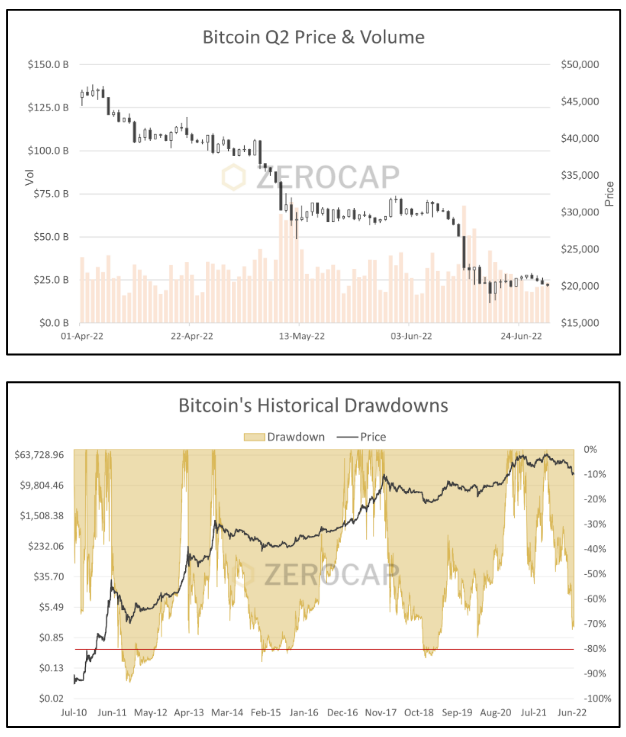
Having recovered much of Q1’s lost ground, Bitcoin continued to edge higher as markets entered the new quarter. However, sentiment took a sharp turn in early April as news broke that the European Parliament voted in favor of outlawing un-hosted wallets within the European Union. Soon after, word of rapid balance sheet reduction from Fed Governor Lael Brainard and concerns of rampant inflation reclaimed the forefront of investor’s minds. De-risking prompted pressure, and Bitcoin was quick to lose footing above $42,000, a key support during the July 2021 retest.
In late April, the IMF revised global growth forecasts to account for macro headwinds, foreshadowing May’s undertones. Suffering from heightened correlation to equities and given the hawkish backdrop, positive news such as Fidelity Investments allowing Bitcoin allocations to 401(k) accounts provided little sustenance for Bitcoin’s price action. Simmering fears and diminished sentiment provided the grounds for a bank run on Terra’s stablecoin, UST. Attempting to preserve UST’s peg, the Luna Foundation Guard sold-off their Bitcoin reserve, prompting prices to spiral, which was further exaggerated by substantial liquidations. In just over a week, BTC price plummeted by over 30% to levels last seen toward the end of 2020.
Following Terra’s capitulation and leading into June, JP Morgan articulated that Bitcoin was 28% undervalued. Soon after, the easing of COVID restrictions in China bolstered global growth sentiment and provided the grounds for Bitcoin to post its first positive weekly return in 9 weeks. However, contagion and the lagged flow on effect of Terra’s unwind came in the form of additional liquidations and defaults. As noteworthy parties such as Celsius and Three Arrows Capital (3AC) fell, so did Bitcoin’s value, dropping to as low as $17,708 which is representative of a 74.5% drawdown from November 2021 ATHs. Overall, Bitcoin’s cumulative return over Q2, 2022 was -56.23%. The cumulative market capitalization change was -$501.8 billion, decreasing to $337.5 billion in capitalization.
Bitcoin On-Chain
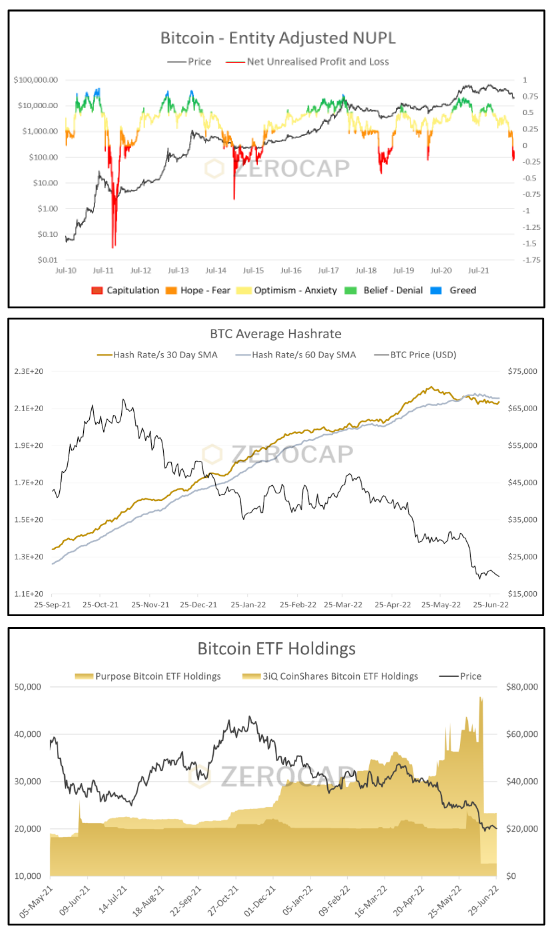
During Q2, unrest was clear amongst market participants. Entity Adjusted Net Unrealised Profit and Loss depicts marketwide net profitability and provides insights into market fear and greed. Until May 2022 and before Terra’s capitulation, this metric resided in the optimistic zone, with some participants retaining a sense of profitability. However, as the quarter progressed and liquidation headlines became increasingly consistent, price edged below $23,000 and market profitability decreased sharply. By late June, this metric moved to levels below zero depicting net losses across the board.
During times of market uncertainty, it is worthwhile understanding the behaviour and position of high conviction market participants such as miners and long-term holders. Looking more closely at miners, May 2022 marked the first month since June 2021 of consistent net selling. Importantly, miners are pro-cyclical. Due to costs, miners tend to sell off and halt operations during market capitulations. During Q2, Bitcoin’s mean hash-rate growth stalled and is now decreasing. Miner capitulations have historically marked cyclical bottoms, and Bitcoin’s hash rate suggests a similar narrative is at play.
Having retraced significantly from its all-time highs in November 2021, the aforementioned unrest seemingly extended to holders within leading Bitcoin ETFs. Offering alternative exposure to Bitcoin, cryptocurrency ETFs have not only grown in popularity but also stature. Despite their significant growth over the last twelve months, the Purpose Bitcoin ETF and Canadian 3iQ CoinShares Bitcoin ETF holdings were cut by over 50% as price headed below $20,000 in June.
Despite substantial de-risking from some investors, price is seeing strong buy-side flow below $20,000. As accumulation continues at these levels, the likelihood of a support base being established in the 18,000 – 20,000 range increases.
Ethereum
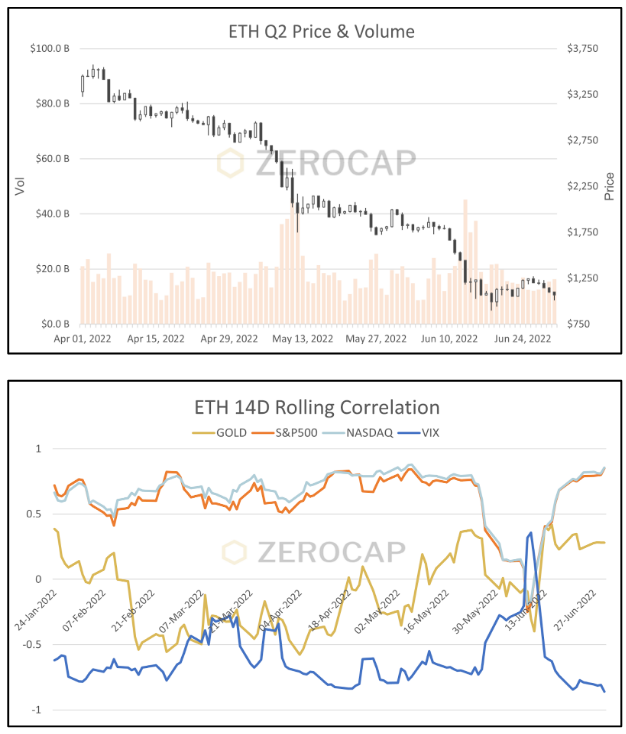
Similar to Bitcoin, Ethereum entered Q2 with an optimistic market outlook. Amidst the global geopolitical tensions and macro pressures, Ethereum’s highly anticipated merge to Proof-of-Stake (PoS) acted to bolster its price action. In light of strong risk-off sentiment, and in contrast to ETH/BTC’s historical relationship in such environments, Ethereum outperformed Bitcoin for most of April and into early May. Ethereum’s merge to PoS is expected to amplify its deflationary properties. Consequently, participants were placing speculative bullish bets on a successful merge. Acting to elevate Ethereum’s price, this attitude was also evident in the derivatives markets, with many favouring strategies to capture upside potential.
However, as the wider cryptocurrency market suffered from the compounding effect of adverse newsflow, ETH started to slip. The growing shadow of the macroeconomic backdrop was reflected in Ether’s price action. As the quarter persisted and as risk-assets continued to sell off, price edged lower. Following April’s immense selling pressure, early May marked a brief consolidation phase around $2,250 although this was quickly lost.
Moving into June, the Ropsten testnet merge to PoS was successfully executed, although its success had little effect on waning price action. By mid-June, news broke that both prominent institutional firms Celsius and 3AC were potentially insolvent. ETH’s price plummeted and volatility soared. On June 13th, exchange futures liquidations reached the highest levels seen in 2022. Following a record eleven-week decline, Ethereum returned -67.4% for Q2. Ethereum’s cumulative market cap changed -$265.79 billion, declining to $128.62 billion in total capitalization.
Ethereum On-Chain
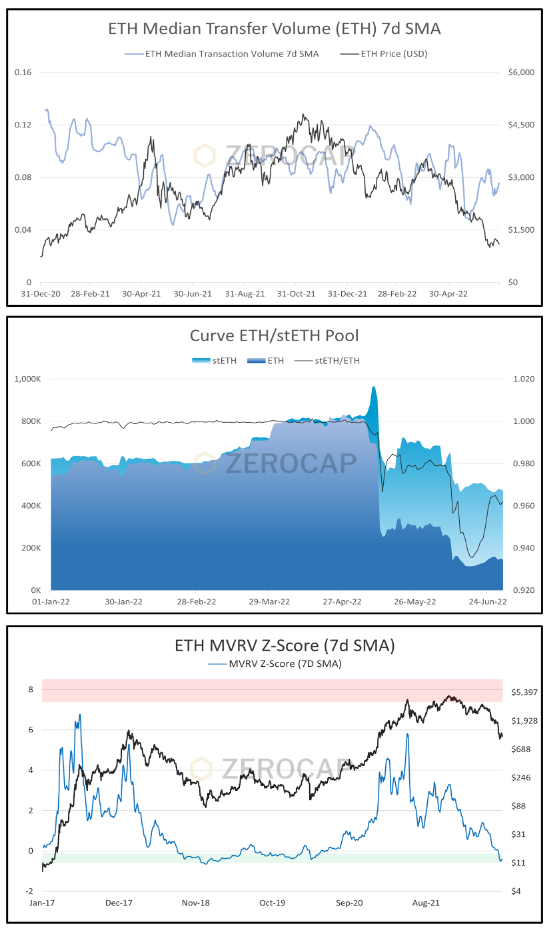
Transaction volumes on Ethereum’s network fell drastically during the quarter. Median transaction volume has often been used to depict network growth and value distributed across the chain. Expectedly, when participants become less willing to pay frequent gas fees to use a network, the price of using a network often follows in tandem. Moreover, Ethereum’s transfer volumes have diminished to levels last seen in December 2020. However, the cheapening of network fees has removed barriers that previously prevented some unique trading strategies.
In Zerocap’s Q1 report, Ethereum’s leading liquid staking platform, Lido, was highlighted. During Q2, the liquid staking token underpinning Lido’s rapid growth, stETH, was tested under stressed market conditions. As institutions were forced to unwind levered positions, liquidity for stETH dried up. Curve is a DeFi protocol that facilitates deposits and withdrawals into and from liquidity pools, whereby depositors receive fees for providing liquidity. Curve has become a strong foundation for the DeFi market’s liquidity. During the fallout of institutions such as Celsius, on-chain activity showed the unwinding of large stETH positions in DeFi protocols. In turn, an imbalance in the ETH/stETH LP pool on Curve was created. The imbalance created a discount between stETH and ETH. This discount continued to widen as the liquidations of large holders of stETH persisted. Whilst stETH will be redeemable for ETH at a 1:1 rate when withdrawals are enabled on the beacon chain post-merge, stETH’s price will likely continue to fluctuate as the demand to liquidate assets into fiat fluctuates in the near term.
The MVRV Z-score ratio has historically acted as an accurate indicator when providing an assessment to ETH’s fair value. It captures the deviation between market cap and realized cap (the on-chain zones at which price is traded). In prior market bottoms, Z-Score values were placed between 0 and -0.4. These ranges have historically acted as opportunities to accumulate at attractive levels. Conversely, values above 4 have commonly been sell signals and marked potential reversals in price. Interesting to note where the price is sitting on this metric.
Derivatives
Options
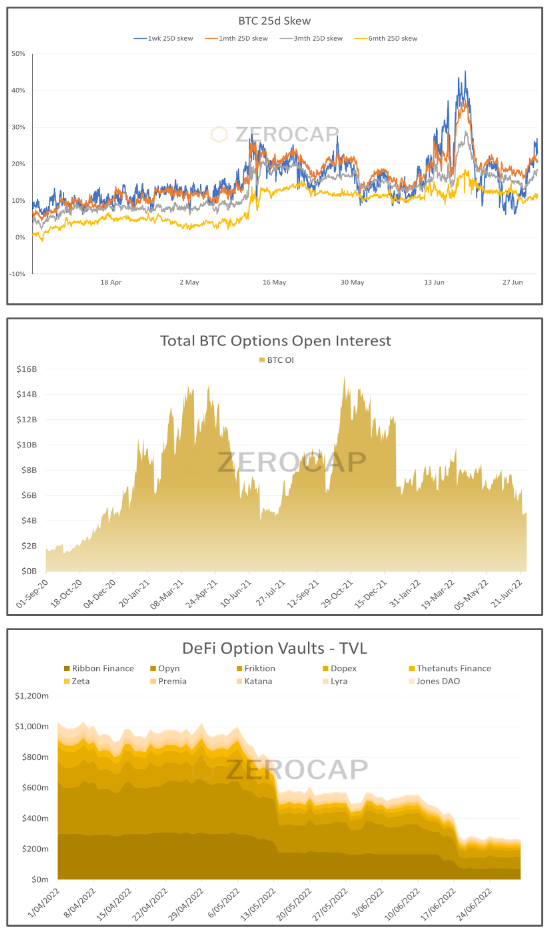
During Q2, there was a clear shift to risk-off and protection-on throughout the LUNA and Celsius/3AC events. This can be seen through the BTC 25d skew, which indicates the price traders are willing to pay for puts (downside protection) relative to calls. In particular, downside puts were bid to extreme levels as traders were willing to pay any price for tail risk protection over fears that cascading liquidation would push prices even lower in the short term. For long-term investors, these scenarios were an amazing opportunity to take advantage of the fear in the market, with Yield Entry Notes offering yields of over 80% annualised at times throughout the quarter.
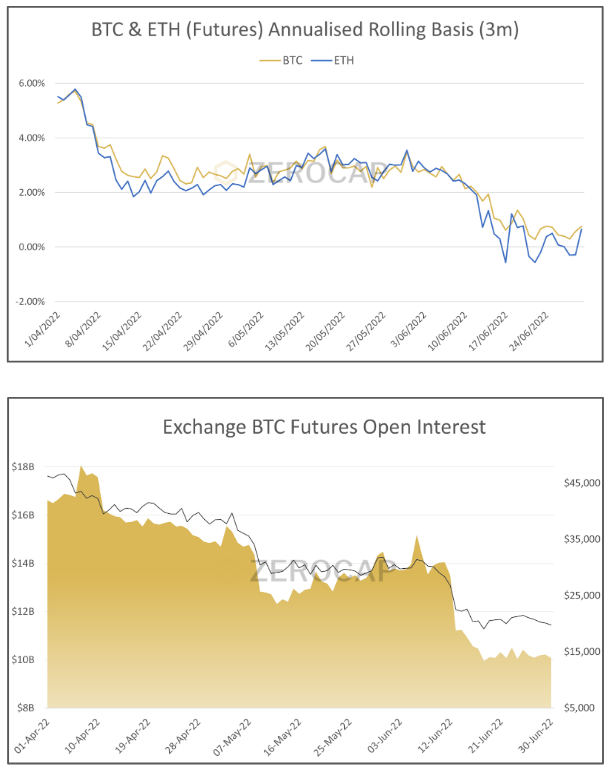
In June last year, Goldman Sachs began offering investors access to non-deliverable forward Bitcoin contracts. Whilst marking significant institutional development in the space, this event is also representative of a move toward a more sophisticated investor base. Correspondingly, investment strategies within the digital asset space are growing in diversity. Since the beginning of 2022, the options market’s open interest has maintained relatively consistent levels. Historically, open interest has fluctuated in sync with market cycles. Options can be utilised to hedge portfolio exposure to market risk and take advantage of significant yield opportunities.
Looking at DeFi and more specifically option vaults there has been a significant fall in TVL, that coincided with the collapse of Terra/Luna and the subsequent liquidity crunch. Yield harvesting strategies which sold weekly puts were hit the hardest. One vault on LUNA saw all capital wiped out in the space of a week during the collapse. After a period of strong growth in 2021 and Q1 2022 it remains to be seen if volumes will return in the back half of this year.
Futures
In light of the market’s recent compression, the number of institutional players continues to grow. A recent occurrence within the digital asset space is the pricing out of arbitrage opportunities in the futures markets. Corresponding to a growing sophisticated investor base, calendar spreads as a delta-neutral strategy has faced significant flattening of the forward curve. Off the back of recent insolvency events, liquidity within the space has diminished. In turn, the flows that once promoted compression of the curve may have been somewhat reduced. Notably, suppressed liquidity within the futures market may cause mispricing of futures across exchanges, forming alternative arbitrage opportunities for participants. Contrastingly, given the reduction of alternative yield opportunities within the space, such as those found in DeFi, calendar spreads as a delta-neutral strategy may be one of the few reliable yield opportunities available to participants. Importantly, the compression of this spread increases the appeal of utilising leverage to enhance yields. This increases the likelihood of significant risk events.
As previously mentioned, Q2 hosted some extreme price moves off the back of risk events. Inherently caused by over-leveraged positions, the recent compression was likely a contributing factor, especially within the context of a period of extreme drawdown. The capitulation of the Terra ecosystem in early May sent markets into a strong unwinding. Liquidations exaggerated the move and saw the market unwind over $2 billion of futures open interest in less than a week. Likewise, corresponding to the fall of Celsius and subsequently 3AC, markets unwound $2.29 billion of futures open interest on June 13th, the largest single-day liquidation of 2022.
Decentralized Finance
Total Value Locked
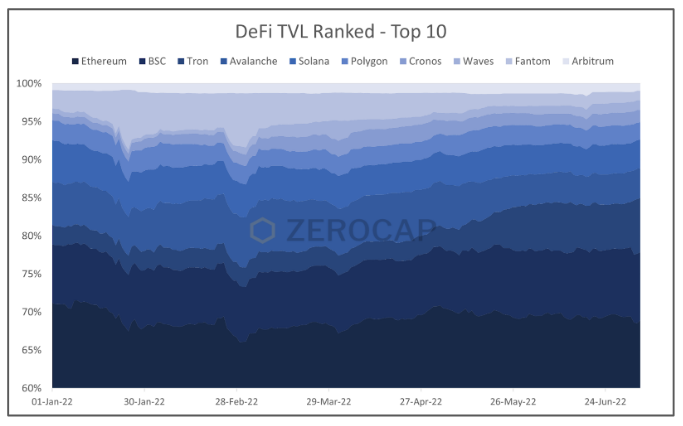
The total value locked (TVL) in DeFi protocols endured a significant retracement in Q2. Despite DeFi’s impressive long-term growth, markets witnessed a drop of $151 billion in TVL QoQ. DeFi’s TVL now resides below $72.8 billion. Last quarter Zerocap touched on Terra’s success and its significant contribution to DeFi’s TVL in Q1. However, Terra’s collapse caused a significant capital outflow to DeFi’s TVL. Notably, $100 billion in TVL was erased within 10 days. As capital fled Terra, the Tron ecosystem provided some temporary support, in the form of capital inflows, to the DeFi space. However, Tron’s native stablecoin, USDD, depegged from $1 in the weeks that followed Terra’s capitulation. Moreover, Tron’s TVL decreased by 42% in just over 7 days. Although the capitulation in the DeFi space is reflective of the broader market drawdown, when compared to its engagement before the bull run, participants and activity within DeFi are at healthy levels. It is important to note, irrespective of the significant strain placed on the space during Q2, several protocols have maintained promising levels of engagement, development and profitability.
DeFi Exploits
The popular DeFi protocol, Beanstalk, which acts as a credit-based stablecoin decentralised application, endured a governance exploit this quarter. Consequently, the protocol lost tokens totalling $182 million. An underlying flaw in the Ethereum-based protocol allowed the exploiter to obtain over 66.66% of the governance voting power after a significant accumulation of Beanstalk’s native token BEAN. To acquire enough voting power, the exploiter obtained approximately $1 billion from a flash loan on one of the largest DeFi lending/loaning protocols, AAVE. Flash loans enable users to borrow substantial amounts from the protocol without necessitating collateral as the borrower is required to pay back the loan in the same block. With such influence, the hacker was capable of draining Beanstalk’s stablecoin liquidity pools. This occurred by altering the protocol’s code so that Beanstalk’s staked assets were automatically sent to the hacker’s wallet. After draining $182 million worth of a variety of tokens, the exploiter paid back the flash loan on AAVE and made a profit of $80 million.
Terra’s Fall From Grace
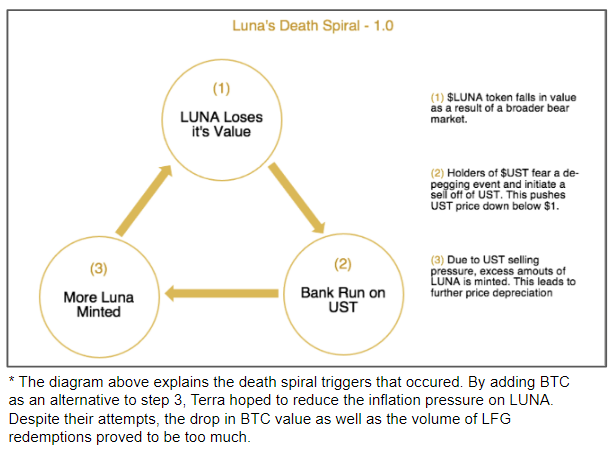
After Terra’s flourishing performance in Q1, the ecosystem’s twin-token model led to a devastating chain collapse theorised in the death spiral depiction shown. LUNA’s death spiral was initiated by a small group of key players. In an incredible display of nuanced understanding of the space, the attackers began by draining ~$285 million of their own liquidity from Anchor, sparking concern amongst those with on-chain alerts. This UST was then bridged to Ethereum and sold on Curve Finance, causing a notable pool imbalance in the largest on-chain pool outside Terra. In turn, this caused a slight depeg for the algo-stable to 0.98. Market participants began to arbitrage the price discrepancy between Curve and other venues. However, those who were overexposed to the UST carry trade began to pull funds. This ultimately led to a bank run on Anchor and subsequently billions of dollars of selling pressure. As UST’s value fell below 0.98, Terra’s chain halted and exchange withdrawal limitations amplified panic, ultimately leading to a ‘sell at all cost’ mentality. TerraUST swiftly dropped to 0.75. Simultaneously, using the Luna Foundation Guard’s (LFG) treasury, users redeemed UST for tokens. As the spiral continued, LUNA experienced significant hyperinflation. Within 5 days, UST’s value fell below 0.10 and the forced selling of billions of dollars worth of BTC caused widespread liquidations and panic selling across the space.
Luna’s collapse, alongside the loss of billions, highlighted the realities of trusting providers of unsustainable yield mechanisms. Moreover, investors began questioning the sustainability of algorithmic stablecoins. Since the UST crash, a multitude of other algorithmic stablecoins, including Tron’s USDD and Waves’ USDN, have lost their USD peg. Despite the fear surrounding reliance on algo-stables moving forward, context is key. For over a year, skeptics have voiced concern surrounding the sustainability of Terra’s model. While the collapse of UST, USDD and USDN appear to be synonymous with the failure of the broader algo-stable theory, the incredibly turbulent Q2 also battle-tested others, with stronger models such as DAI and FRAX surviving. While the media and crypto skeptics have been quick to dismiss the entire space as a Ponzi scheme, for those paying close attention, the last 3 months has proven the efficiency of a truly open market and highlighted the models that can survive significant stress tests.
Funds Mismanagement At The Highest Level
Celsius
This quarter, market participants witnessed crypto industry giants face serious risks of insolvency. Celsius, a well-known centralized credit platform that offers lending and borrowing, was one notable example. Celsius was thrust into the limelight after significant portions of its AUM was wiped out off the back of substantial liquidations. While these liquidations were associated with the market drop, the firm’s woes actually began earlier this year. Celsius was deeply exposed to a variety of multi-million dollar hacks, the Terra collapse and the space’s broader liquidity crunch.
Fear began with a slew of rumours circulating surrounding the firm’s ability to meet potential margin calls. Given Celsius’ known liquidity, participants doubted their ability to meet capital requirements if prices were to continue dropping. This coincided with the beginning of consistent stETH unloading on Curve which led to a similar pool imbalance seen just weeks earlier in the UST pool. The firm appeared to possess an incredibly leveraged balance sheet, a large portion of which was impacted by capital losses or locked up in liabilities such as ETH 2.0 staking. Due to an inability to meet customer demand, Celsius paused client withdrawals. Correspondingly, Celsius desperately attempted to field margin calls, both on-chain and with other firms. The company justified its decision to stop withdrawals claiming that extreme market conditions forced its hand. Although, the consensus remains that the firm ultimately failed to manage its customer’s money responsibly. Following the announcement of withdrawal limitations, Celsius hired restructuring attorneys to assist them in managing the fallout. However, numerous counterparties have detailed hundreds of millions in outstanding debts. This suggests that Celsius’ customers and counterparties are likely to endure a significant haircut on their asset’s value.
Three Arrows Capital
Proceeding Celsius’ freeze of user’s funds, rumours regarding Three Arrows Capital (3AC) also facing insolvency spread like wildfire. Due to overwhelming pressure and as markets edged into the $20,000’s, 3AC’s overleveraged positions were liquidated. Market fear was exacerbated and prices were driven further downward.
3AC was touted as an incredibly proficient proprietary trading firm. A firm that benefited from the insurmountable growth the space offers. Much of this growth was derived and exaggerated with leverage from unsecured lenders. While acting to amplify returns when markets are going up, losses are exaggerated in market drawdowns. This was especially true in June which hosted Bitcoin’s worst MoM return since 2012. The widely held assumption that the crypto-savvy traders would practice conservative risk management seemingly proved false. To the demise of the firm, in an attempt to lever up their positions, 3AC placed itself in a frivolous position. When the first domino fell, in the form of Luna, the flow-on effects eventually forced the firm into liquidating copious amounts of assets at a steep discount.
Both firms are currently placed in a transitory phase. The coming months will outline whether the industry giants can rise from the ashes. Although, should broader market conditions remain, these two high-profile breakdowns could be the first of many.
NFTs & Metaverse
Overview
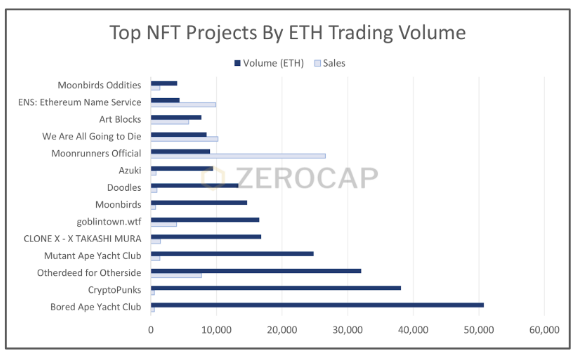
Following some significant growth and volume in Q1, the NFT market’s momentum slowed during Q2, with new users and daily trading volumes diminishing. Reduced publicity and liquidity prompted a contraction in demand. In an already illiquid market, further demand reduction caused a sector-wide collapse in floor prices. Even blue-chip projects like Bored Ape Yacht Club (BAYC) and CryptoPunks, saw 5-6 figure reductions in floor value. Likewise, NFT-based games also lost popularity and usage. The number of new players on play-to-earn games decreased and in turn the value of in-game rewards dropped. This resulted in a vicious cycle of a reduced monetary incentive to play, further decreasing interest. This was flagged as a key gap in the play-to-earn offering. However, this is the first time we have seen a sustained collapse across multiple high-value projects such as Axie Infinity and DeFi Kingdoms.
Solana Inflows & Free Mints
A stand-out over Q2 was the surge in Solana NFT traction with collections like Okay Bears and DeGods seeing heightened demand. This was primarily driven by the success of Solana-based StepN, a move-to-earn game that caused significant inflows onto the network. However, after being banned in China and many DDoS attacks damaging the project’s reputation, StepN’s token value and floor price took a hit. Much like the aforementioned play-to-earn games, StepN was scrutinised by many for the lack of sustainability in its tokenomics and incentive model. Free NFT mints have grown in popularity this quarter. Collections like Goblintown.wtf and We Are All Going to Die (WAGDIE) periodically topped volume tables above high-profile projects like BAYC. However, free-to-mint NFTs are not a new concept. For example, CryptoPunks NFTs were free to mint. However, the jump in popularity and volume is largely due to creators placing more value on secondary sales commission as opposed to mint charges.
Otherside
Yuga Labs’ metaverse project, Otherside, broke records for the most successful NFT mint to date. Within 3 hours, 55k Otherdeed NFTs sold, netting Yuga Labs $317 million in APE. Additionally, 24 hours after the Otherdeed mint, the land sales reached a trading volume of $561 million from the secondary market. Yet, the event sparked controversy due to utilising a flat purchase price of 305 APE as opposed to dutch auctions. This, alongside the overwhelming demand for Otherdeed NFTs and a lack of contract optimizations caused gas fees to rise as high as 8k GWEI. In total, $127 million in ETH was paid by investors in gas fees. Beyond this, 1.6k ETH was lost due to over 14k failed transactions and the sheer number of attempted mints crashed Etherscan.
After these gas wars, Yuga Labs commented that it may create a new layer-1 blockchain to support the Otherside metaverse. With many claiming this was a choreographed plan to publicise the potential for excessive costs to Ethereum-based NFT launches, the ApeCoin DAO has voted for Otherdeed smart contracts to remain on Ethereum. Nonetheless, the crypto community criticised Yuga Labs’ arrogance in trivialising the creation of a unique blockchain and their failure to optimise the minting contract to reduce costs for users.
Emerging Themes
Crypto In the Regulator’s Crosshairs
Binance ICO Investigation
The Securities and Exchange Commission (SEC) outlined an investigation into Binance’s BNB initial coin offering (ICO). The inquiry questions whether BNB was in fact a security when it launched and was sold to the public in 2017. This follows a number of SEC claims against cryptocurrency companies; none of which have eventuated in prosecution thus far. Regulation often forms an initial shock factor. However, regulatory body involvement is positive and indicates development. Moreover, as the space progresses within its evolving regulatory framework, individuals and institutions will be the beneficiaries. Examples such as this, will be essential in defining the applicability of securities law on various cryptocurrency token models.
Nathaniel Chastain Case
In a novel case, Nathaniel Chastain has been found guilty in the Manhattan Federal Court for charges regarding a scheme to commit insider trading with NFTs. Chastain, who at the time was the product manager at OpenSea, was purchasing specific NFTs before featuring them on OpenSea’s homepage. Profiteering on the initial floor price pump, which is primarily driven by publicity, Chastain captured 2-5x increases on investment. The former OpenSea employee was charged in 2021 for wire fraud and money laundering. Both charges carry a maximum sentence of 20 years of prison. It is important to note that these two charges do not classify NFTs as securities. This is because the offences do not strictly relate to securities as a charge of insider trading would. While dampening the NFT and Opensea’s image, as with the Binance ICO investigation, cases such as this act provide precedence against future foul play. Moreover, these investigations continue to shape a framework that promotes open markets while also protecting investors.
Lummis Bill
Calls for regulation within the crypto industry are becoming more prevalent by the day. This Q2, Cynthia Lummis and Kirsten Gillibrand released a bill relating to how governments will perceive the digital asset class. The bill outlines that most tokens are not to be presumed as securities. Moreover, DAOs will not be required to be incorporated as entities. This bill also does not preclude DAOs from utilising independent offshore entities to receive profits, a positive for such organizations. A key concern among crypto participants related to the proposed requirement for digital asset exchanges (DEAs) to restrict the assets that are listed, thereby restricting their availability to users. DEAs inherently include decentralised exchanges (DEXs) and other protocols which utilise automated market makers. DEXs allow for permissionless listing through smart contract addresses. Hence, by design DEXs will not be able to comply with this requirement. While the bill outlines promise, it also contains some oversights that place limitations on the growth of key verticals. All in all, this is expected to be the first iteration of many – as long as industry representatives continue to work with forward-thinking politicians and regulatory bodies, it is likely that the industry will have a strong framework to grow upon.
EU Releases MiCA Regulations
The EU has agreed on legislation that aims to tame the ‘crypto wild west’. By enforcing rule coverage for issuers of unbacked crypto assets, stablecoins, trading platforms and crypto wallets, the regulation intends to reduce the risk associated with foul play. Whilst this framework is a step in the right direction, there have been standout components that are receiving strong backlash from the industry. Most notably, the new regulation places a cap on stablecoin flows. USDT’s daily transaction volume is approximately 48 billion euros. However, this bill places limitations of 200 million euros per day in transactional flows. The recent controversy regarding stablecoins has likely contributed to this decision.
Layer 2 Growth
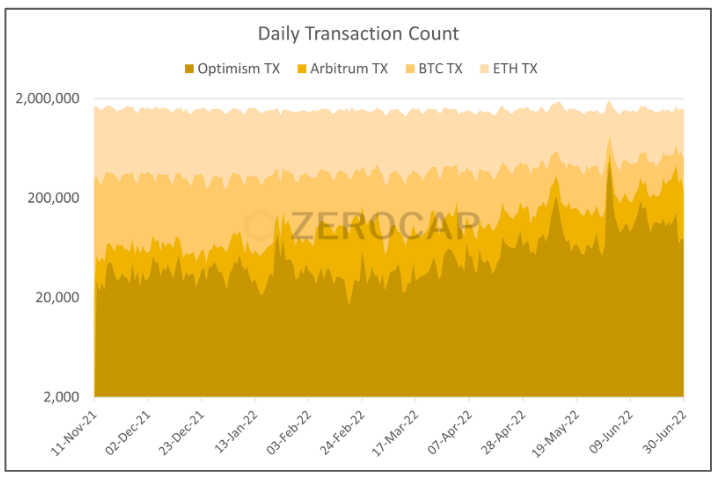
The layer 2 race intensified this Q2 as a multitude of incentive mechanisms began. On-chain value is being accrued by layer 2 protocols at a significant rate. In less than six months, the two largest layer 2s that utilise roll-up technology, Arbitrum and Optimism have seen transaction volume increase by 304% and 662% respectively. While a large portion of this change can be attributed to incentive schemes, it is expected that their low-cost and growing product offering will position them well in the medium term.
Optimism entered the spotlight toward the end of May upon the airdrop of their OP token. This event marked the first of the “big 4” layer 2 networks; Arbitrum, Optimism, StarkWare and zkSync, to launch a native token. However, Optimism’s increased engagement resulted in severe network delays. Notably, upon its airdrop, the token experienced extreme selling pressure, leading to the price of OP falling by over 70% in the week of its release.
StarkWare, a layer 2 that utilises zero knowledge rollups, raised $100 million in a Series-D funding round, granting a post-funding valuation of $8 billion. This valuation quadrupled the $2 billion value of StarkWare six months prior to this funding round. This valuation alone is indicative of the growth of layer 2’s as well as the growing interest from capital providers.
This Q2 has depicted the current and future significance of layer 2s. It may be likely that the majority of ETH’s network flows will be from individuals utilising the services of layer 2s. Adoption rates and the number of protocol launches are key metrics to observe in Q3.
Macro Overview
Economic and Market Update
As global markets entered Q2, systemic supply chain bottlenecks continued to limit the potential for any near term recovery. War persisted in Ukraine, China suffered from Covid-19 lockdowns and a real estate debt crisis continued. For the first time since 1918, Russia defaulted on its foriegn country sovereign debt. Russia claimed “force majeure” due to the impact of recently imposed sanctions. This default comes despite the estimated $100 billion Russia made from oil and gas exports in the first 100 days of the war in Ukraine. Russia, the world’s second largest oil and gas producer responded aggressively to the imposed sanctions. For example, nations such as Finland, Bulgaria and Denmark, who refused to pay for gas in Rubles, were cut off from Russia’s gas supply. While demand for Oil and Gas remained, supply diminished and prices skyrocketed. The GAZP reached a high of $322.99, Brent $123.25 and WTI $121.31. Germany’s National Gas Emergency plan was thrusted into its secondary stage coinciding with growing concerns regarding the future of Europe’s Nord Stream Russian Gas Link. Under this secondary ‘alarm phase’, decommissioned coal power plants would be restored. Contrastingly, some metals performed relatively poorly. Copper diminished over 23% in value throughout the quarter, reaching a low of $3.54, Gold slumped to a low of $1,784.60.
China’s ‘Zero-Covid’ policy, eventuated in continuous lockdowns, putting the breaks on local consumer demand, and domestic productive capacity. Markets are likely to witness a continuation of the already tarnished supply chain bottlenecks suppressing global markets. Notably, China’s dominance over the solar panel industry continues to grow. Imported energy dependent nations such as Germany may find a strong dependence on the forming concentrated monopoly. Moreover, strengthening climate goals may perpetuate demand for China’s growing industry.
Fears of the global economy overheating were affirmed in Q2, evidenced in the increased cost of raw resources, placing immense pressure on supply side inflation. June’s higher than expected US consumer price index (CPI) result saw US headline inflation breach the predicted 8.8%, concluding the quarter 30 basis points higher at 9.1%, the same headline rate as the United Kingdom (UK). In an attempt to curb skyrocketing inflation, the US Federal Reserve (FED) hiked interest rates 75 basis points, an increase not seen since the bond market crisis of 1994. The BOE was quick to hike rates implementing its 5th consecutive rate increase at 25 bps, the Reserve Bank of Australia (RBA) was similarly hawkish with a hike of 50 bps in May.
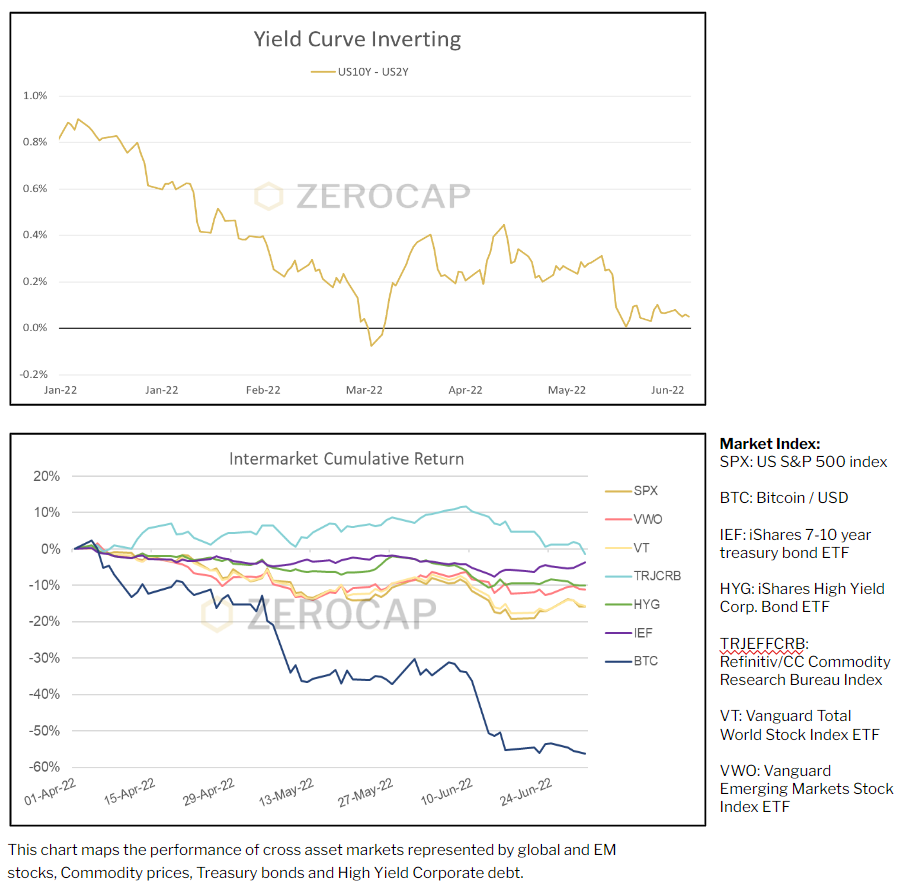
Rising interest rates coupled with decreased investor confidence saw a shift from equities to long term bonds, with demand for latter increasing substantially. Partial 2Y & 10Y bond yield inversions were visible throughout Iceland, Canada, the US and UK, signalling the possibility of a recession around the corner.
China’s high yield corporate bonds have come under increased scrutiny. Following major property developer Evergrande Group’s default on its debt last December, defaults from other players in the real estate sector are becoming increasingly common.
The performance of various asset classes reflected the macro economic conditions at hand. The S&P and Nasdaq posted returns -20.6% and 29.5% respectively, their worst performances in decades. As a consequence of strong de-risking, we saw a pivot into safe haven assets. The USD Index (DXY) rallied to levels not seen since 2003 and within the digital asset space, Bitcoin and USDC’s relative market dominance increased. Drawdowns for crypto assets were across the board, with portfolio diversification initiatives failing to provide a strong protection against inflation, recession and credit risk. Given the scale of price depreciation across asset classes, it could be said that much of the hawkish outlook has already been priced into markets. Hence, investors may only need a ‘less bad’ outlook to justify positive price action.
Zerocap Products
Performance of Zerocap Products
ZC Funds – Bitcoin Trust and Smart Beta
Turbulence in the wider crypto market has incidentally led to a spike in interest for our unit crypto trust funds. Given heightened counterparty risk within the cryptocurrency space, there was a noticeable shift in demand toward regulated fund structures. This change can be attributed to the protections regulated funds provide investors.
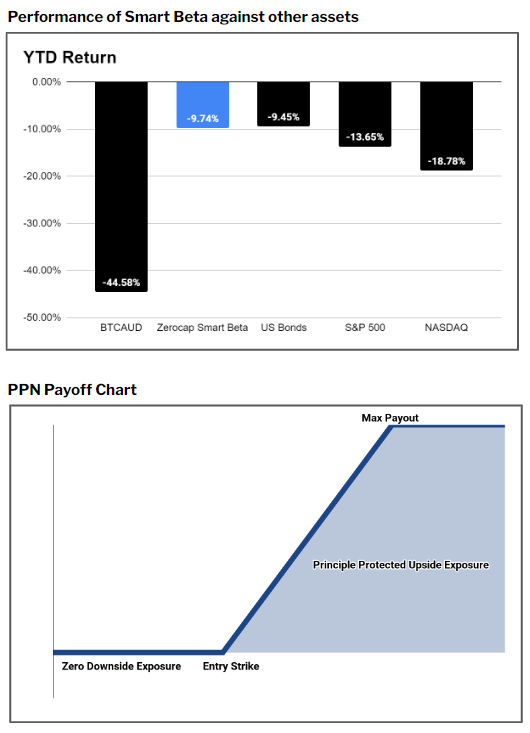
The shift illustrates the benefits of incorporating greater sophistication into crypto products. Zerocap’s Smart Beta Bitcoin Fund has successfully absorbed a large portion of Bitcoin’s volatility by strategically rebalancing exposure each week. As a result, the fund has contained drawdown and outperformed most other asset classes. As seen in the chart to the right, the NASDAQ is down 19%, SPY is down 14%, Bitcoin is down 45% but Smart Beta is only down 10%.
Yield Entry and Exit Notes
Given the recent increase in volatility, Zerocap’s Yield Entry and Exit notes possessed heightened yield opportunities for investors. When turbulence peaked during the LUNA capitulation and again during Celsius and 3AC’s defaults, Yield Entries were priced paying upwards of 40% p.a in yield. For individuals looking to effectively enter the market, Yield Entry notes provided an attractive opportunity to earn yield while likely entering a spot position at a heavy discount to current spot prices.
Principal Protected Notes
In Q2 Zerocap launched the world’s first Cryptocurrency Principal Protected Note (PPN). PPNs allow investors to gain upside exposure to Bitcoin with zero downside price exposure. In other words, 100% of the principal is returned if the price decreases below the strike level at the expiry of the term. The PPN cures Bitcoin’s historically heavy drawdown profile. Having dropped as low as 85% in the past and currently residing near a 70% drawdown from November ATHs, the PPN presents an exciting value proposition for any investor. Notably, holders of the PPN experienced a 0% drawdown this quarter despite a -56.23% return QoQ.
Contact
For more on our thinking and insights into the markets, visit zerocap.com/insights.
FAQs
What is Zerocap’s role in the digital assets market?
Zerocap is a wealth management firm that specializes in digital assets. They provide deep liquidity, insured custody, and yield products for clients looking to transition seamlessly between fiat and digital assets. They also offer a Lloyds-insured custody with a range of structured investment options for compounded returns.
What were the key highlights in the crypto market in Q2 2022?
The Q2 of 2022 saw significant drawdowns in Bitcoin and Ethereum due to a continued liquidity crunch and a hawkish macro environment. However, there was consistent accumulation and buy-side flows on the desk. Interest in Zerocap’s Structured Product offering continued, allowing clients to earn healthy yields while awaiting market entries.
How did regulatory attention impact the crypto industry in Q2 2022?
There was an uptick in regulatory attention in Q2 2022. In the US, the SEC launched an investigation into the Binance ICO from 2017, and the Lummis Bill was introduced to provide further structure to the industry’s regulatory framework. In Europe, updates were made to the markets in crypto assets (MiCA) framework to guard against market abuse and manipulation. These developments are likely to benefit the crypto industry and its participants by removing barriers to entry for investors awaiting regulatory clarity.
What was the performance of the cryptocurrency market in Q2 2022?
The total cryptocurrency market capitalization contracted by 58.82% in Q2 2022. Bitcoin’s total cryptocurrency market share increased by 1.77%, while Ethereum experienced a 4.76% decrease. The collapse of Terra Labs’ LUNA and Terra USD caused significant market-wide selling pressure.
What were the significant events in the DeFi space in Q2 2022?
The total value locked (TVL) in DeFi protocols saw a significant retracement in Q2. Despite DeFi’s impressive long-term growth, markets witnessed a drop of $151 billion in TVL QoQ. DeFi’s TVL now resides below $72.8 billion. The collapse of Terra’s LUNA and the subsequent liquidity crunch were significant events in the DeFi space during this Q2.
Zerocap is a wealth management firm for digital assets, providing deep liquidity, insured custody and yield products for clients looking to move seamlessly between fiat and digital assets.
Our global banking infrastructure and principal trading model enables fast settlement in all major currencies and OTC assets. We offer a Lloyds-insured custody, with a range of structured investment options for compounded returns.
We are the firm for private clients, family offices and institutions.
Disclaimer
This document has been prepared by Zerocap Pty Ltd, its directors, employees and agents for information purposes only and by no means constitutes a solicitation to investment or disinvestment. The views expressed in this update reflect the analysts’ personal views about the cryptocurrencies. These views may change without notice and are subject to market conditions. All data used in the update are from Tradingview, Coingecko, Glassnode, DefiLlama and respective chain scanners such as Etherscan. Contents presented may be subject to errors. The updates are for personal use only and should not be republished or redistributed. Zerocap Pty Ltd reserves the right of final interpretation for the content hereinabove.
This document is issued by Zerocap Pty Ltd (Zerocap), an Authorised Representative (#001289130) of Garnet Capital Pty Ltd (Garnet) AFSL 340799. This document is made available to you on the basis that you are a Wholesale or Professional Investor. This document is not intended for retail clients nor should it be distributed to retail investors. This document has been prepared for information purposes only and may not be relied on for any other purpose (including, without limitation, as legal, tax, financial or investment advice). Nothing in this document should be interpreted as an endorsement or recommendation of a particular investment or strategy. Any opinions expressed are general in nature and do not consider the objectives, financial situation or needs of any person. Before making an investment decision you should conduct your own due diligence, consider what is suitable for you and your personal circumstances and obtain your own independent advice. Zerocap Pty Ltd (Zerocap) makes no representation or warranty (express or implied) that any information contained in this document is accurate or complete. Information included in this document is based on matters as they exist as of the date of preparation of this document and will not be updated or otherwise revised. Certain statements reflect Zerocap’s views, estimates, opinions or predictions which may be based on proprietary models and assumptions, and there is no guarantee that these views, estimates, opinions or predictions are currently accurate or that they will be ultimately realised. There are significant uncertainties inherent in the forward-looking statements included in this document. Neither historical returns nor economic, market or other indications of performance should be considered as an indication of future results or performance. Investing in cryptocurrencies and/or digital assets involves a substantial degree of risk and could result in the loss of the entire amount invested. Nothing in this document is intended to imply that investing in cryptocurrencies and/or digital assets may be considered “conservative”, “safe”, “risk free”, or “risk averse”.
You should be aware that dealing in products that are leveraged carries significantly greater risk than non-leveraged products. As such, you could both gain and lose larger amounts. You may even sustain losses well in excess of your initial deposit and also in excess of the margin required to establish and maintain any positions in the leveraged products. Accordingly, you should carefully consider whether leveraged products are appropriate for you in light of your financial circumstances and risk profile.
Like this article? Share
 Share
Share  Tweet
Tweet  Post
Post 
Latest Insights
On-chain Bitcoin Metrics: The Main References
In the realm of cryptocurrency investment, on-chain Bitcoin metrics provide a critical lens through which investors can gauge market conditions and make informed decisions. These
What is the Base Blockchain? The Coinbase Layer 2
The Base blockchain, introduced by Coinbase, represents a significant development in the realm of cryptocurrency and blockchain technology. It is a layer-2 solution built on
Bitcoin Mining in the US: Main Challenges
Bitcoin mining in the United States has recently faced a range of challenges, from regulatory hurdles to community and environmental concerns. As a significant hub
Receive Our Insights
Subscribe to receive our publications in newsletter format — the best way to stay informed about crypto asset market trends and topics.